Skip to content

Household food waste calculator

See what wasted food may be costing your household.

Wasted food is an estimate, not a till receipt. A UK household of four’s edible waste was about £1,000 in 2022 (WRAP). A US consumer, groceries and restaurants, lost about $728 in 2023 prices (EPA, April 2025). This tool uses those official averages as labelled defaults, or your spend × a disclosed rate, and always shows a range. It does not claim Dietrack users save that money.

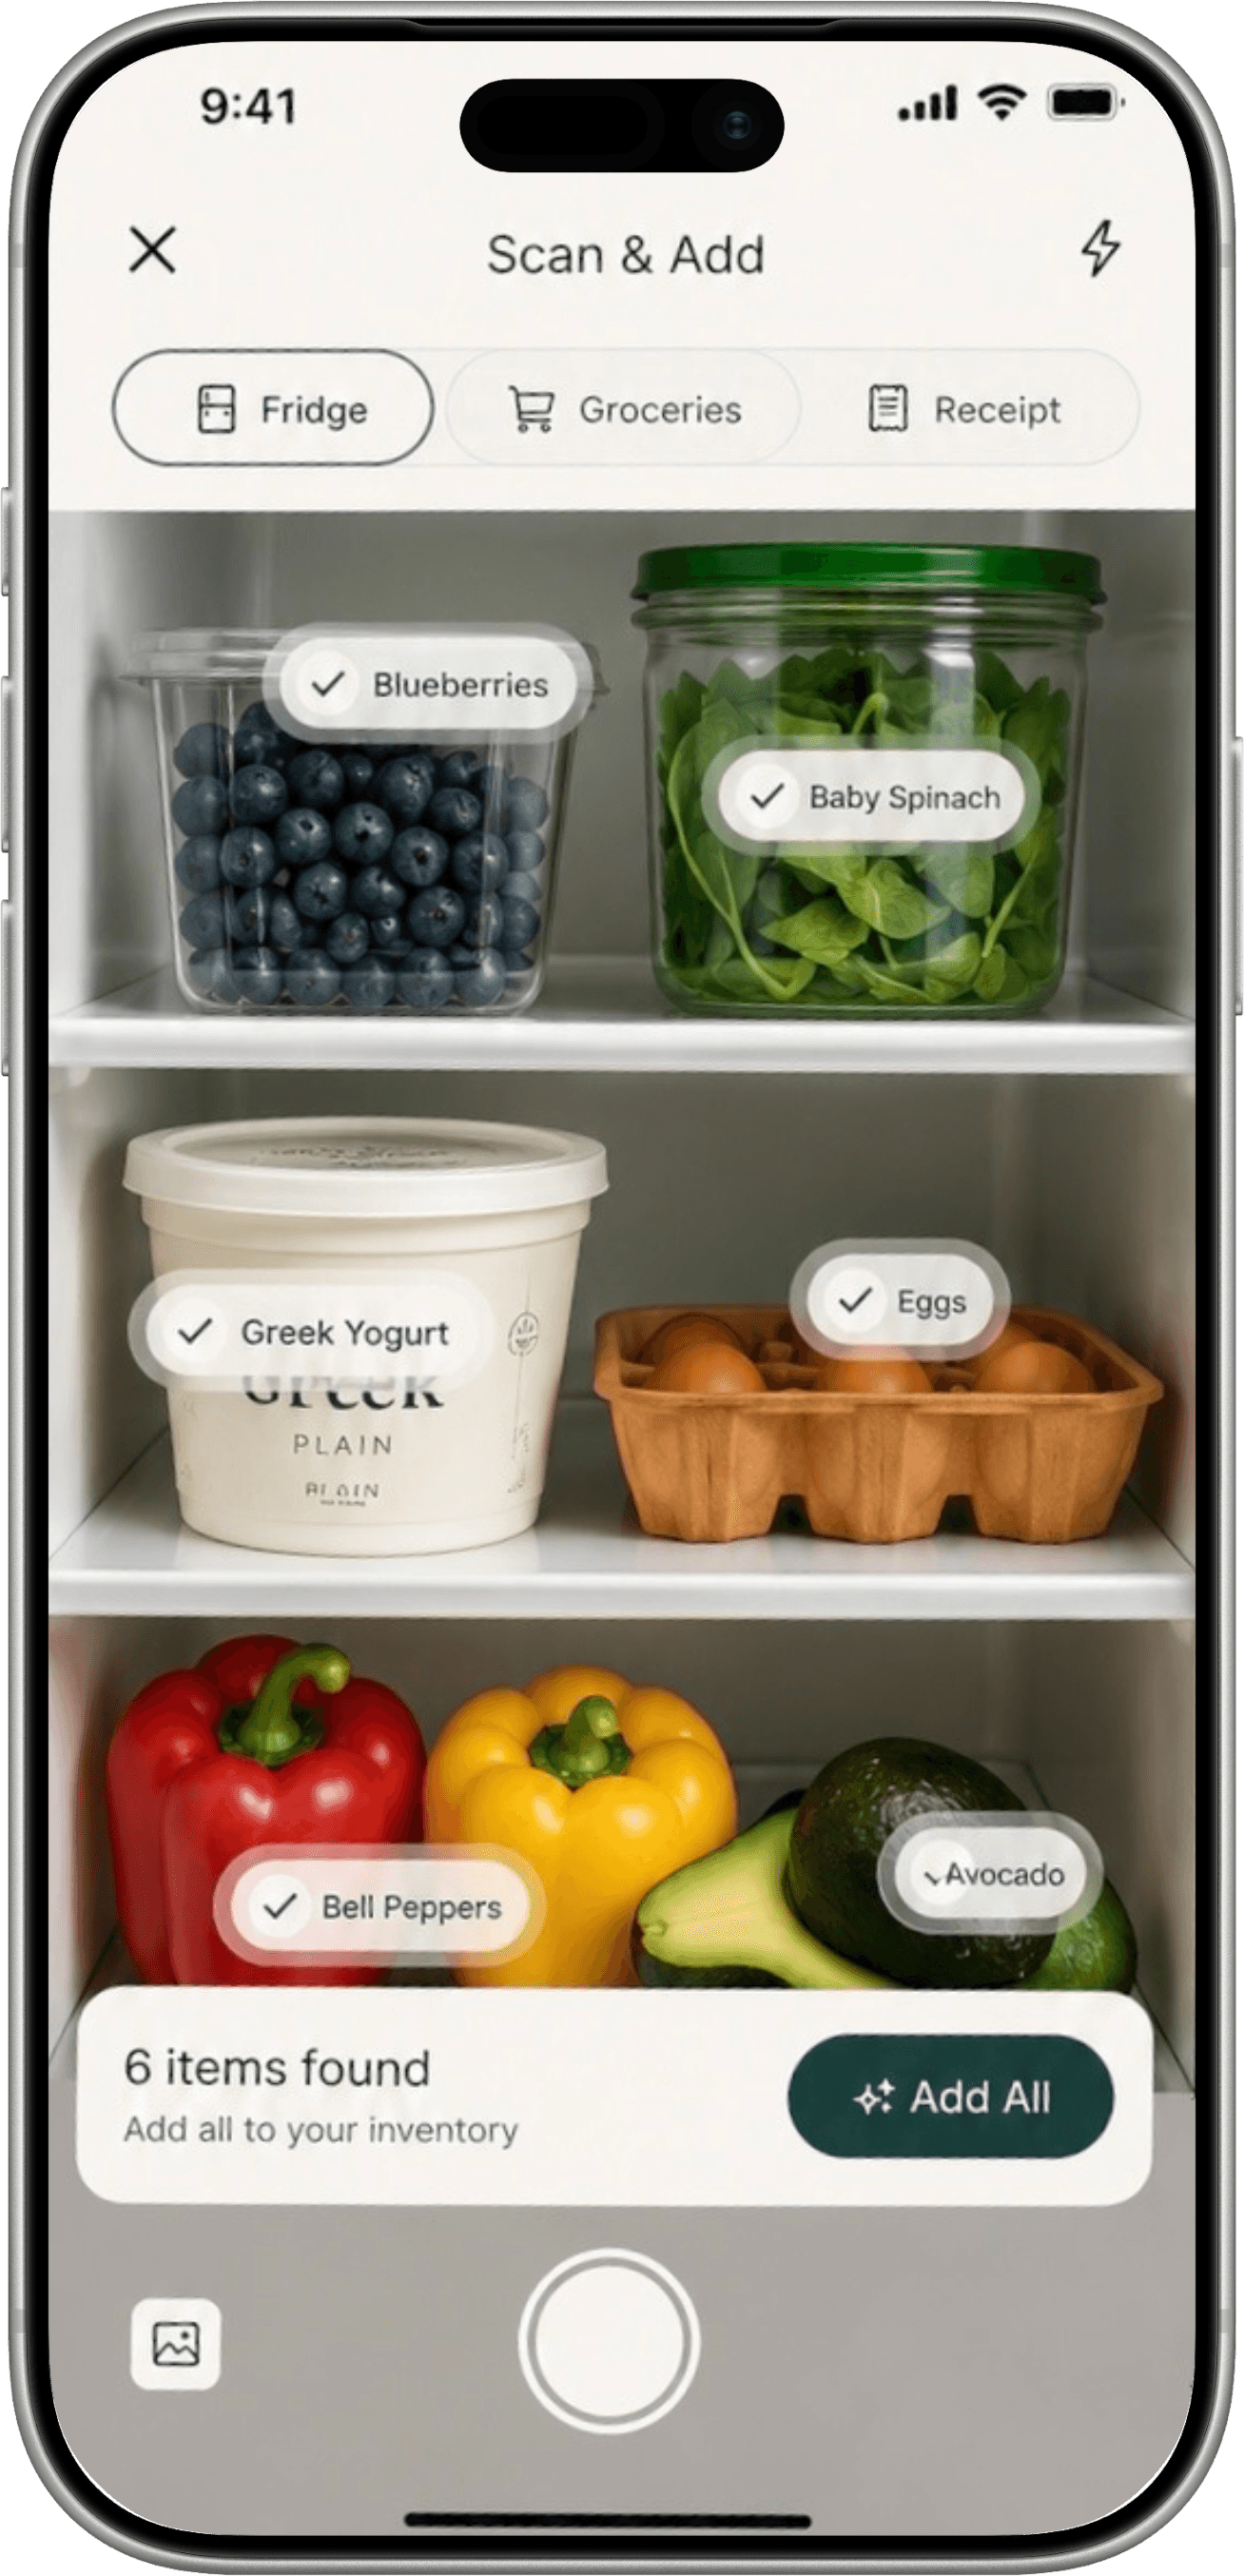
Dietrack scanning a fridge and tagging food already in the kitchen.

Your kitchen

Estimate inputs

Pre-filled as a US household of four on the official-average pattern , EPA’s published household-of-four figure, groceries and restaurants, not a tracking of your bin. Switch region to United Kingdom for WRAP.

Region

Region

UK uses WRAP 2022. US uses EPA 2025 (groceries and restaurants). Other uses UNEP high-income kilograms; money only if you enter spend.

Grocery spend (optional)

$
Spend period

If you enter groceries, you will see a grocery scenario beside the EPA default, not mixed with it, and not called EPA’s 11%.

Waste pattern

Waste pattern

The highlighted mid is about 0.5× / 1.0× / 1.5× of the official average. The displayed range uses a wider planning band (about 0.4–0.7 / 0.7–1.3 / 1.2–2.0). Not Dietrack user data. Most people think they waste less than average, they cannot all be right.

I already weigh scraps (optional override)

Overrides the national average for that unit. We do not invent kilograms from money with a hidden £/kg.

Reduction scenario

Reduction scenario

What-if arithmetic. Not “meal planning saves 25%,” and not a Dietrack result.

Your estimate

Ranges, not fake precision

Every headline number is an estimate with a named source, year, and geography. Change the inputs and this block updates.

Your money estimate

EPA 2025 · US · FAH + FAFH

Estimated dollars / year

$2,913 (mid estimate)

Range $2,039$3,787

Estimated / month

$243 (mid estimate)

Range $170$316

EPA’s consumer-level figure for a household of four is $2,913 (2023 prices), then the average pattern band. Includes groceries and restaurants. Restaurant waste is priced at grocery prices, so the dollar total is likely an underestimate. This is not the 2010-price “$1,500 family of four” line.

Weight / year

EPA 2025 · US consumer · edible lb

Kilograms

465 kg (mid estimate)

Range 325 kg604 kg

Pounds

1,025 lb (mid estimate)

Range 718 lb1,333 lb

Household size × 256.2 lb/person edible consumer-level waste (EPA 2025 / LAFA), including groceries and food service. A household of four is 1025 lb before the pattern band. Rice is omitted in LAFA, so weight is slightly understated.

Leftover illustration

A weekly slice of the money estimate above is about $39 $73, mid $56. If even one substantial leftover (a roast, a pan of pasta) is binned most weeks, that sits inside this weekly slice. It is an illustration, not a scientific leftover value and not a price for any particular meal.

After the number

What to do this week.

The estimate is the cost of food that was already in the kitchen. The useful move is to cook that first, not to feel bad about last month’s spinach.

  1. 01

    Snap the fridge or pantry

    See what is actually there before you shop. Dietrack’s fridge inventory is built for that job. A notebook also works.

  2. 02

    Cook from what you already paid for

    Start from ingredients, not from a blank meal-plan grid. The meal planner from ingredients you already have is the Dietrack version of that loop.

  3. 03

    Shop only the gap

    The third cumin is how averages happen. A smart grocery list that reads your kitchen subtracts stock before you add milk. Tactics without an app: how to save money on groceries.

Snap your fridge or pantry. Cook what you already paid for.

Free on iOS and Android. Dietrack is not the best tool if you need a weighed seven-day diary with lab-grade kilograms, a kitchen scale and a notes app beat us there. It is the right next step if you want dinner from the food you already bought.

Download Dietrack on the App StoreGet Dietrack on Google Play

Scopes

Why UK and US numbers disagree.

Same search query. Different fractions. Mixing them into one “household waste” figure is how competing calculators go wrong.

WRAP’s 11% is edible waste as a share of food brought into the home in the UK in 2022. EPA’s 11% is waste dollars as a share of all US food spending in 2023, food at home and away from home, and EPA says that percentage is likely an underestimate because restaurant waste is priced at grocery prices. Same digit. Different pie.

Weight disagrees too. WRAP’s 88 kg/person is UK household food and drink, edible plus inedible, all discard routes. UNEP’s 81 kg/person is a high-income household-stage average, not a UK WRAP clone and not money. EPA’s 256.2 lb/person is edible consumer-level waste including restaurants.

Official food-waste statistics compared by scope
FigureWhat it measuresWhat it is not
FAO ~1/3 of food produced (2011)Share of production, globallyNot a typical grocery basket
USDA ERS ~31% of 430 billion lb (2010)Retail + consumer food supply, USNot 31% of your till receipt
WRAP ~88 kg/person, ~210 kg/household (2022)UK household food and drink, edible + inedibleNot 1,000 kg per household; not UNEP’s 81 kg
WRAP edible = 11% of food brought homeUK in-home edible / purchases into the homeNot EPA’s 11% of all food spending
UNEP 81 kg/capita (2024, 2022 data)High-income household stageNot a pound or dollar figure
EPA $728/person (2025 report, 2023 prices)US edible consumer cost, groceries + restaurantsNot 2010’s ~$1,500 family of four; not grocery-only

Mix

Weight is not money.

A produce-heavy bin can look large on the scale and small on the receipt. Meat does the opposite.

EPA’s 2025 consumer-cost tables make the split obvious: meat is the highest dollar category per person (about $133.48), while added sugars lead pounds (about 37.0 lb). Other dairy is second in dollars ($74.32); fluid milk is a separate EPA category, not rolled into that dairy figure. That is a national mix, not a picture of your fridge, which is why this page does not offer category sliders pretending to be your kitchen.

WRAP’s UK money figures are edible purchase cost only. They do not include cooking energy, travel, or what the council spends to treat the waste. A compost caddy changes the methane story. It does not un-spend the shop.

EPA Table 2 contrast: dollars versus pounds
US consumer mix (EPA 2025)DominatesPer person / year
MeatDollars$133.48
Other dairyDollars (2nd)$74.32
Added sugarsPounds37.0 lb

Figures from EPA Table 2 / Figure 1 in Estimating the Cost of Food Waste to American Consumers (April 2025). Citation, not sliders.

UK diaries

Why edible food leaves UK kitchens.

WRAP’s 2022/23 diaries, edible weight. Self-reported reasons, useful for where to look, not a diagnosis of your week.

  • Not used in time

    ~39%

    Looked or smelled off (~22%) plus past the date (~17%).

  • Cooked, prepared, or served too much

    ~25%

    The leftover that never becomes tomorrow’s lunch.

  • Preference / perceived inedible

    ~22%

    Someone in the house will not eat it.

Method

How the estimate is calculated.

The widget and this HTML use the same formulas. If JavaScript fails, the worked examples below still stand.

Pattern bands (assumptions)

Rarely / about average / often set the highlighted mid at 0.5× / 1.0× / 1.5× of an official figure. The displayed range uses a wider planning band (0.4–0.7 / 0.7–1.3 / 1.2–2.0) so you never get a single fake-precise pound. They are planning scenarios, not WRAP’s published envelope alone, and not measured Dietrack kitchens.

United Kingdom. WRAP 2022

  • Default money: household size × £260 edible per person, except size 4 uses WRAP’s published £1,000 (not 4 × £260 = £1,040).
  • Default kilograms: size × 88 kg total food and drink. Edible kilograms = that total × 0.73. We do not multiply WRAP’s 210 kg/household figure by household size, that 210 kg is already a whole average household (~2.4 people), not a per-person rate.
  • If you enter grocery spend: annual spend × 11% (WRAP edible share of food brought home) × the pattern band. The official WRAP default stays visible beside it. They are not averaged.

United States. EPA 2025

  • Default money: size × $728, except size 4 uses EPA’s rounded $2,913. Includes food at home and away from home.
  • Default weight: size × 256.2 lb edible consumer-level (size 4 = 1025 lb), including restaurants. Rice is omitted in LAFA, so dollars are slightly understated.
  • If you enter grocery spend: a scenario of about 5% / 10% / 15% of that spend (rarely / average / often). That scenario is shown beside the EPA default. We never multiply groceries by 11% and call it EPA. EPA’s ~11% is of all food spending, including restaurants.

Other regions. UNEP 2024

Kilograms: size × 81 kg (high-income household stage). Money only from your spend × the same grocery scenario bands as the US spend path. No invented national currency default. Dietrack is a Dutch company; that is not a reason to output euros for a Kenyan shop.

Weigh-in override

Weekly kilograms or weekly money, annualised (× 52), with a ±20% week-to-week spread labelled as an assumption. We do not convert £ into kg with a hidden price-per-kilo.

Climate range

Off unless you tick the widget. Kilograms × 2.53.6 kg CO₂e/kg. The lower anchor is FAO 2013’s global edible-wastage mix (~2.5 kg CO₂e/kg). The upper bound, and the UK mid , is WRAP’s implied intensity (3.6 kg CO₂e/kg edible from 16 Mt / 4.4 Mt). There is no unsourced 4.5 factor. EPA did not publish a household CO₂e factor. A high-meat bin sits higher; salad sits lower. This probably isn’t worth treating as a personal carbon audit.

Reduction what-if

Mid and range × 0.75 or 0.50. WRAP’s 73% edible share is food that could have been eaten; WRAP does not treat that as identical to “avoidable”, potato skins sit in edible/preference. Individual 25% or 50% cuts are not a trial result on this page.

Worked example. UK, four people, about average, no spend

This is a WRAP worked example, not the widget default. Switch the region control to United Kingdom to match these rows.

Worked UK example for a household of four
OutputLowMidHigh
Edible £ / year (WRAP)£700£1,000£1,300
Total kg / year (WRAP, edible + inedible)246 kg352 kg458 kg
Edible kg / year (73% of total)180 kg257 kg334 kg

Worked example. US, four people, EPA default

This is the widget’s default if JavaScript never runs. Source pills on the widget match these rows. EPA dollars include restaurants.

Worked US example for a household of four
OutputLowMidHigh
Consumer $ / year (EPA, includes restaurants)$2,039$2,913$3,787
Edible lb / year (EPA consumer-level)718 lb1,025 lb1,333 lb

Honesty

Limitations.

  • National averages are not your kitchen. Neff, Spiker and Truant (2015) found 73% of a US panel said they discard less than the average American household. Three percent said more. That cannot all be true.
  • EPA dollars include restaurants. A household that never eats out should treat $728 × size as too high for groceries alone, use the grocery scenario beside it, labelled as a scenario.
  • Per-person × household size ignores the evidence EPA cites that waste per person often falls as households grow. Size 4 is the one place we use the agencies’ published household totals.
  • WRAP HTML still shows £2,650 per person. The PDF says £260. This page follows the PDF.
  • ReFED’s ~$780/capita (2023, cited in EPA) is a different method. We use EPA.
  • Prices move. WRAP is 2022; EPA is 2023 prices in a 2025 report. Last reviewed 18 August 2026.
  • No leftover storage times on this URL. That is food-safety content for how long leftovers last, with USDA FSIS and UK leftover rules, not a calculator sidebar.

Sources

Primary sources, opened.

Retrieved 18 August 2026. Competing blogs are not sources.

  1. WRAP, Household Food and Drink Waste in the United Kingdom 2022. Report PDF. Landing page (HTML money figure is a typo; do not use): wrap.ngo resource page.
  2. US EPA, Estimating the Cost of Food Waste to American Consumers (EPA/600/R-25/048, April 2025). Report PDF. EPA landing page.
  3. UNEP, Food Waste Index Report 2024 (2022 data). UNEP record.
  4. USDA ERS, food loss at retail and consumer levels, the ~31% supply figure used only as a contrast. ERS food-loss page.
  5. FAO, Gustavsson et al. 2011 (one-third of food produced; about 1.3 billion tonnes). Global food losses and food waste (PDF). FAO, Food Wastage Footprint 2013 (3.3 Gt CO₂e, ~ 2.5 kg CO₂e/kg global mix). Food wastage footprint summary (PDF). Production and footprint anchors, not household grocery waste.
  6. Neff, Spiker, Truant, “Wasted Food: U.S. Consumers’ Reported Awareness, Attitudes, and Behaviors,” PLOS ONE 2015. doi:10.1371/journal.pone.0127881.

Further reading

If you wanted the encyclopaedia, not the widget.

Get the app

Snap your fridge or pantry. Cook what you already paid for.

Free on iOS and Android. No promised pounds.

Download Dietrack on the App StoreGet Dietrack on Google Play